Hollyglen and Del Aire were two of the hottest markets in all of the South Bay. Homes often had multiple offers and sold over list price. See  the full list of the 159 homes that sold in 2018 in Hollygle and Del Aire. The average list price for the year was a pretty impressive $821,000 with an even more impressive average sales prices of $837,000 meaning on average homes sold well higher than list price. That’s especially impressive given that many sellers listed their homes for record numbers.
2018 By the Numbers
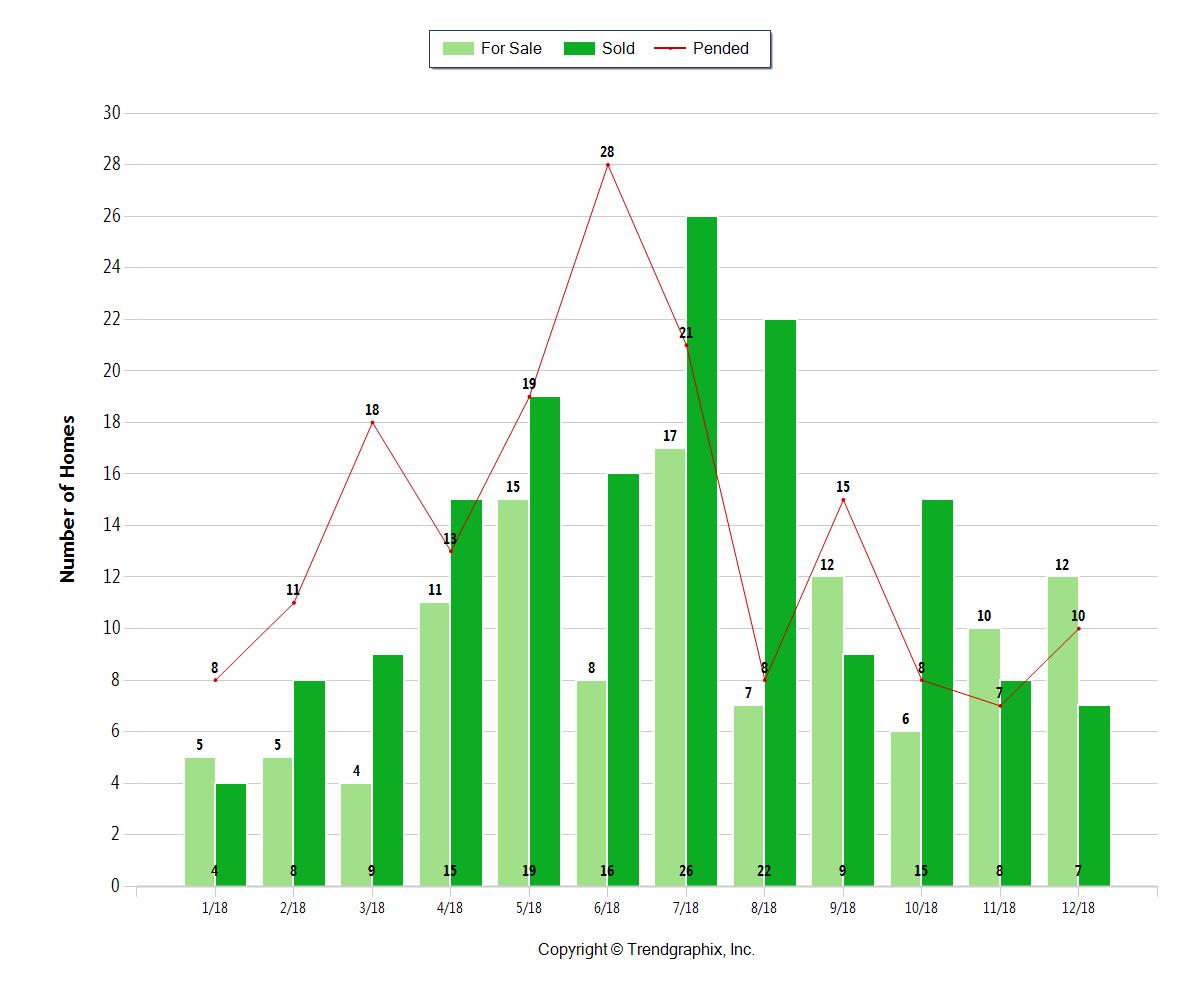
See the chart below for a month by month analysis of the Hollyglen and Del Aire real estate market.
|
Jan |
Feb |
Mar |
Apr |
May |
June |
July |
Aug |
Sep |
Oct |
Nov |
Dec |
| For Sale |
5 |
5 |
4 |
11 |
15 |
8 |
17 |
7 |
12 |
6 |
10 |
12 |
| New Listingq |
8 |
12 |
18 |
23 |
25 |
18 |
29 |
8 |
17 |
8 |
11 |
11 |
| Sold |
4 |
8 |
9 |
15 |
19 |
16 |
26 |
22 |
9 |
15 |
8 |
7 |
| In Escrow |
8 |
11 |
18 |
13 |
19 |
28 |
21 |
8 |
15 |
8 |
7 |
10 |
Months
of Inventory (Closed Sales) |
1.3 |
0.6 |
0.4 |
0.7 |
0.8 |
0.5 |
0.7 |
0.3 |
1.3 |
0.4 |
1.3 |
1.7 |
Months
of Inventory (Pended Sales) |
0.6 |
0.5 |
0.2 |
0.8 |
0.8 |
0.3 |
0.8 |
0.9 |
0.8 |
0.8 |
1.4 |
1.2 |
Absorption
Rate (Closed Sales) % |
80 |
160 |
225 |
136.4 |
126.7 |
200 |
152.9 |
314.3 |
75 |
250 |
80 |
58.3 |
Absorption
Rate (Pended Sales) % |
160 |
220 |
450 |
118.2 |
126.7 |
350 |
123.5 |
114.3 |
125 |
133.3 |
70 |
83.3 |
| Avg. Active Price |
$831,000 |
$700,000 |
$1,040,000 |
$921,000 |
$925,000 |
$816,000 |
$847,000 |
$772,000 |
$829,000 |
$879,000 |
$913,000 |
$853,000 |
| Avg. Sold Price |
$777,000 |
$807,000 |
$785,000 |
$820,000 |
$857,000 |
$856,000 |
$854,000 |
$857,000 |
$892,000 |
$800,000 |
$763,000 |
$889,000 |
Avg.
Sq. Ft. Price (Sold) |
583 |
583 |
555 |
594 |
565 |
606 |
548 |
616 |
584 |
630 |
596 |
581 |
Sold/List
Diff. % |
101 |
101 |
104 |
102 |
103 |
104 |
100 |
103 |
103 |
101 |
99 |
100 |
Sold/Orig
LP Diff. % |
99 |
101 |
104 |
102 |
102 |
103 |
99 |
103 |
102 |
101 |
99 |
99 |
Avg
Days on Market |
47 |
17 |
11 |
19 |
28 |
11 |
17 |
17 |
13 |
14 |
43 |
22 |
| Median Sold Price |
$770,000 |
$739,000 |
$805,000 |
$809,000 |
$870,000 |
$840,000 |
$823,000 |
$819,000 |
$880,000 |
$795,000 |
$707,000 |
$885,000 |
Hollyglen 2018 Stats


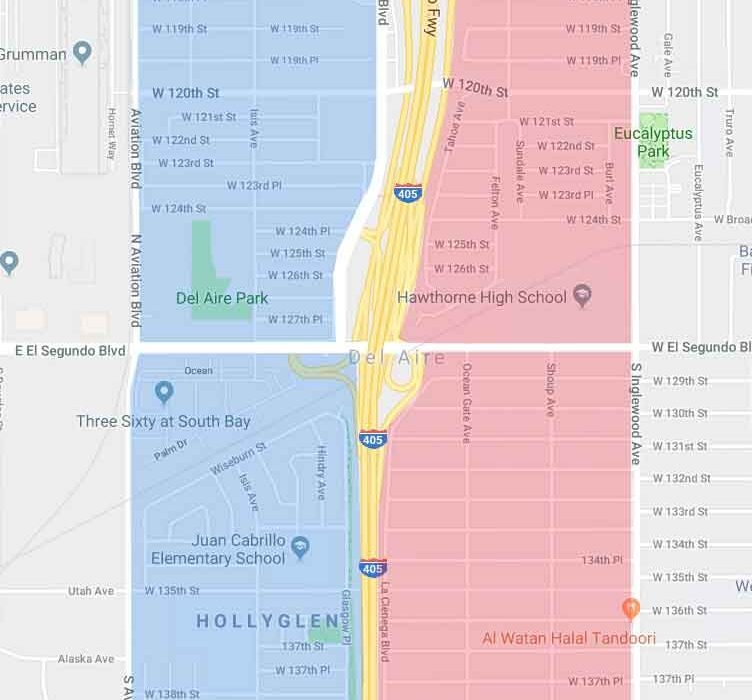
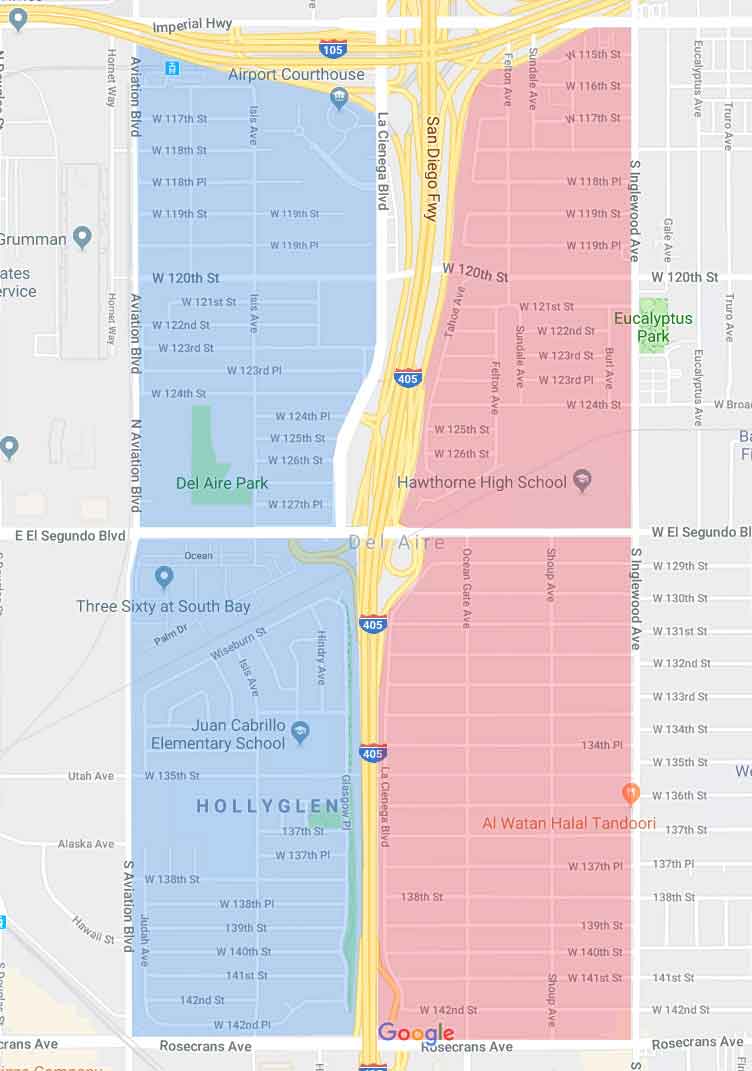 location.” From a real estate market perspective, the Hollyglen/Del Aire area basically consists of two distinct areas….the strip of homes west of the 405 Freeway and the homes East of the 405. Values have always been higher on the west for a number of reasons. All of the homes west of the freeway attend the Wiseburn School District while only about half of the homes east of the 405 do (rest are part of Centinela Valley district). There is less commercial around the neighrhoods on the west.