Another Record Sale in 360 South Bay
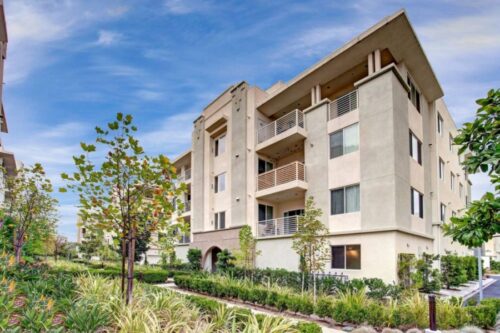

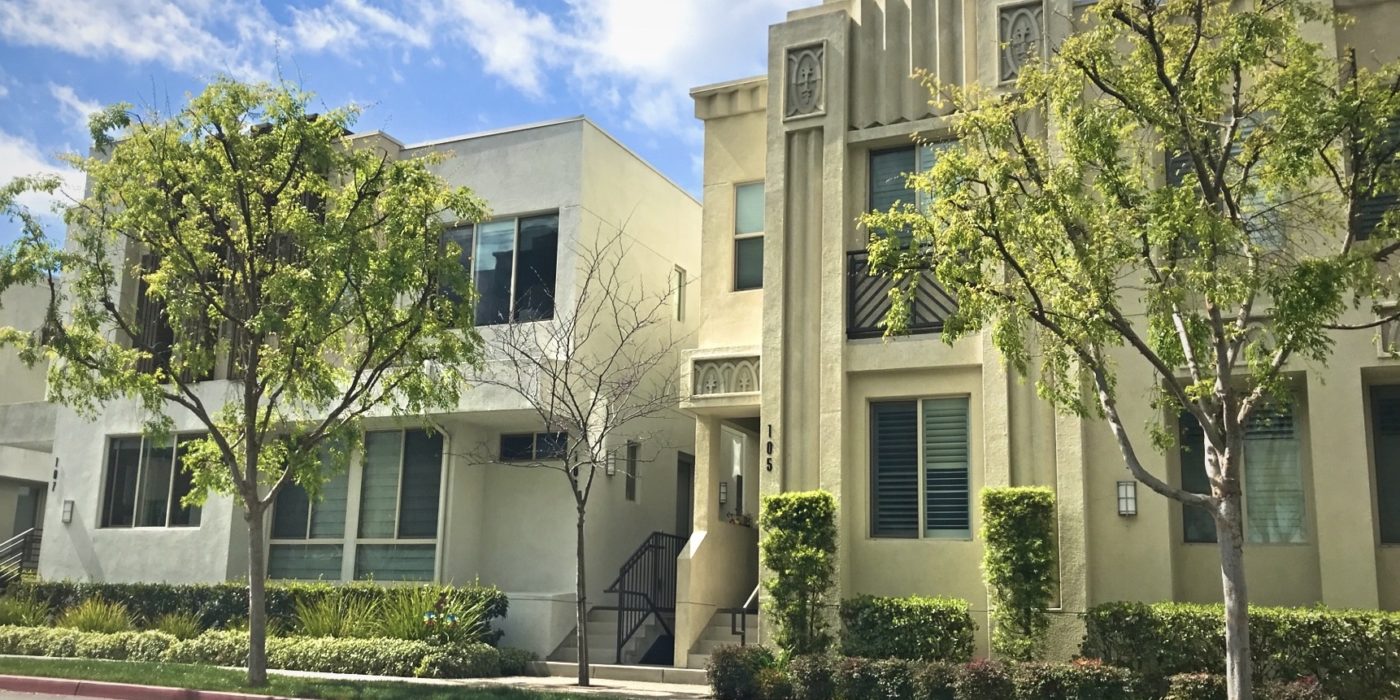
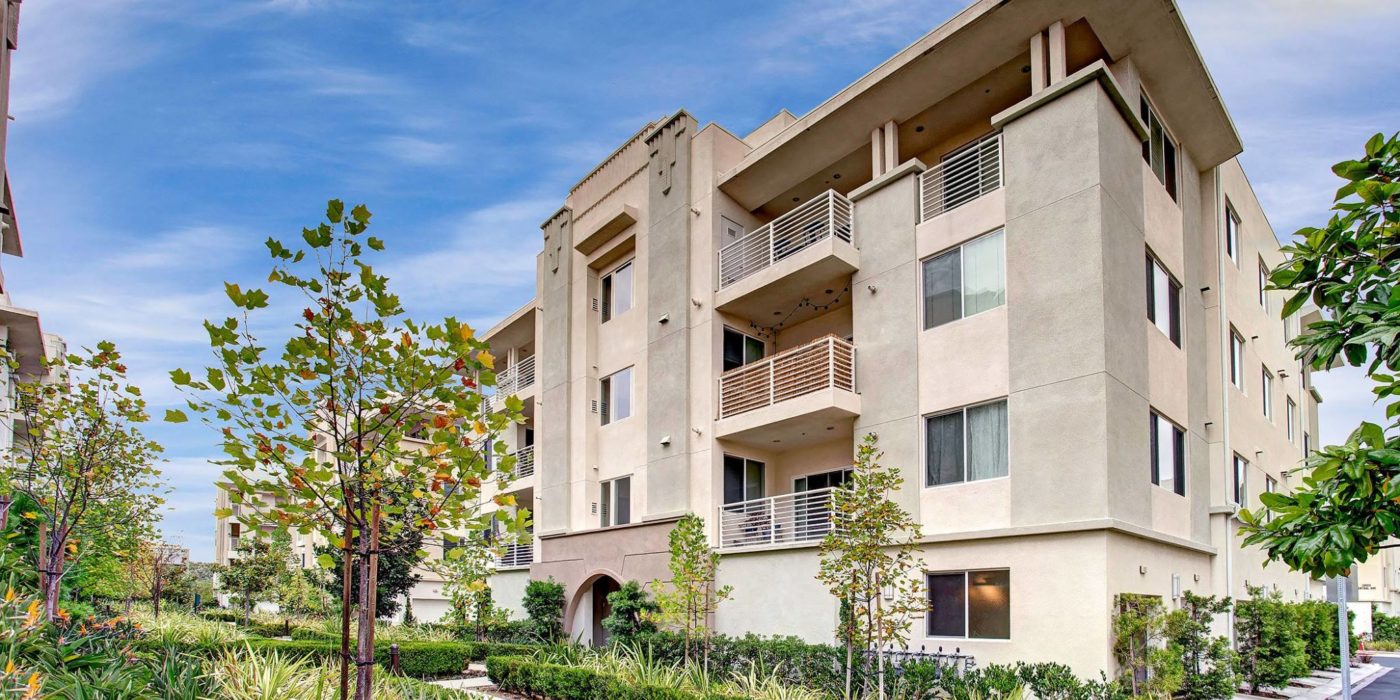
We are pleased to announce our latest sale in the gated community of Three Sixty in the Hawthorne CA neighborhood of Hollyglen. Keith was fortunate to represent the buyer in the purchase of of this beautiful residence 1 townhome in Row.
We had worked with Jared for quite a while and wanted to sincerely thank him for putting his trust in us. We couldn’t be happier for the latest homeowner in the community. View all of the recent sales and pending escrows in Three Sixty South Bay
View the current homes for sale in Three Sixty
Three Sixty and Hollyglen real estate specialist Keith Kyle of Vista Sotheby’s International Realty represented the buyer.
It was a great month for home sales and home prices in the Hollyglen and Del Aire neighborhoods of Hawthorne CA. Take a look below at all of the homes that sold, prices, addresses, details and more. Of the homes that sold 1 was located in Fusion South Bay with 2 of the sales being in the gated community of Three Sixty.
Search the active listings in Hollyglen and Del Aire
| MLS # | Prop Type | Address | Sold Price | $ Per Foot | Bed/Bath | Sq feet | Year | Sold Date | |
| SB20259244 | SFR/D | 5122 W | 129th ST | $815,000 | $824.06 | 3/1,0,1,0 | 989/P | 1944/PUB | 3/12/2021 |
| SB21015212 | TWNHS/A | 5507 W | 149th PL #16 | $820,000 | $678.81 | 2/2,0,1,0 | 1208/B | 2006/ASR | 3/3/2021 |
| SB21027492 | SFR/D | 4848 W | 136th ST | $840,000 | $816.33 | 3/1,0,0,0 | 1029/A | 1947/ASR | 3/17/2021 |
| SR21007128 | SFR/D | 5130 W | 132nd ST | $840,000 | $750.00 | 3/1,1,0,0 | 1120/A | 1953/PUB | 3/3/2021 |
| PV20249988 | SFR/D | 5130 W | 131st ST | $840,000 | $638.78 | 3/2,0,0,0 | 1315/A | 1947/ASR | 3/1/2021 |
| SB20230902 | SFR/D | 5003 W | 136th ST | $850,000 | $574.32 | 3/2,0,0,0 | 1480/A | 1954/PUB | 3/23/2021 |
| SB21028336 | CONDO/A | 12917 | Central AVE #203 | $852,500 | $596.57 | 2/2,0,0,0 | 1429/B | 2011/PUB | 3/19/2021 |
| SB21000446 | SFR/D | 5234 W | 124th ST | $870,000 | $686.66 | 2/2,0,0,0 | 1267/A | 1950/PUB | 3/15/2021 |
| SB21027588 | SFR/D | 5011 W | 137th PL | $875,000 | $518.67 | 3/2,0,0,0 | 1687/A | 1947/ASR | 3/17/2021 |
| ND20262870 | SFR/D | 12105 | Judah AVE | $909,000 | $592.18 | 3/1,1,0,0 | 1535/A | 1949/ASR | 3/11/2021 |
| PW21033118 | SFR/D | 4835 W | 132nd ST | $915,000 | $814.78 | 3/0,2,0,0 | 1123/B | 1946/ASR | 3/30/2021 |
| PV21026037 | SFR/D | 5413 W | 123rd ST | $919,774 | $650.94 | 3/1,0,0,0 | 1413/E | 1951/ASR | 3/23/2021 |
| SB21003802 | SFR/D | 5015 W | 119th PL | $939,000 | $492.65 | 3/2,0,0,0 | 1906/A | 1988/ASR | 3/4/2021 |
| SB21027761 | SFR/D | 5225 W | 123rd PL | $1,010,000 | $612.86 | 3/2,0,0,0 | 1648/A | 1950/ASR | 3/24/2021 |
| 21692784 | SFR | 5534 W | 123Rd ST | $1,025,000 | $659.59 | 4/1,1,0,0 | 1554/OTH | 1950 | 3/19/2021 |
| PV21030545 | SFR/D | 5235 W | 123rd PL | $1,025,000 | $654.95 | 3/0,2,0,0 | 1565/A | 1950/ASR | 3/30/2021 |
| PV21015970 | SFR/D | 5020 W | 135th ST | $1,040,000 | $670.10 | 3/2,0,1,0 | 1552/A | 1946/ASR | 3/30/2021 |
| SB21011735 | SFR/D | 14003 | Judah AVE | $1,135,000 | $1,033.70 | 3/1,0,1,0 | 1098/A | 1954/ASR | 3/12/2021 |
| SB21026954 | TWNHS/D | 5555 | Palm DR | $1,197,000 | $643.20 | 3/2,0,1,0 | 1861/A | 2014/ASR | 3/23/2021 |
| SR21030869 | SFR/D | 5326 W | 138th ST | $1,205,000 | $1,072.06 | 3/2,0,0,0 | 1124/A | 1955/ASR | 3/26/2021 |
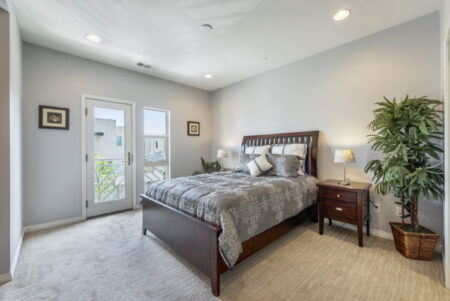
We are so happy for all involved in our latest sale in the Flats. This was an off market sale and we represented both the buyers and the sellers of this beautiful 2 bedroom condo ideally located overlooking the playground. We were thrilled to be able to put the buyers and sellers together and to have such wonderful clients. Congratulations to all involved. Contact top Three Sixty realtor Keith Kyle to find if he has buyers for your home.
To our friends and clients in Hollyglen, Del Aire, Hawthorne, Three Sixty and Fusion…..we want to wish you and yours a very happy Easter.
Take a look at the homes that sold during February in the neighborhoods of Hollyglen and Del Aire in Hawthorne CA.
View the current homes for sale in Hollyglen and Del Aire
| MLS # | Type | Address | Price | $ Per Foot | Bed/Bath | Sq Feet | Year | Sold Date | |
| WS20238966 | CONDO/A | 5410 W | 149th PL #10 | $692,000 | $690 | 2/2,0,0,0 | 1003/E | 2007/PUB | 2/10/2021 |
| SB21007599 | CONDO/A | 5405 W | 149th PL #10 | $740,000 | $740 | 2/2,0,0,0 | 1000/A | 2007/ASR | 2/23/2021 |
| SB20249208 | TWNHS/A | 5506 W | 149th PL #13 | $794,000 | $580 | 2/1,1,1,0 | 1370/A | 2006/ASR | 2/12/2021 |
| SB20264931 | SFR/D | 4910 W | 137th ST | $950,000 | $552 | 3/2,0,0,0 | 1722/A | 1947/PUB | 2/5/2021 |
| SB21011217 | SFR/D | 5534 W | 134th ST | $979,000 | $871 | 4/2,0,0,0 | 1124/A | 1955/PUB | 2/26/2021 |