Hollyglen and Del Aire Home Sales for August 2019
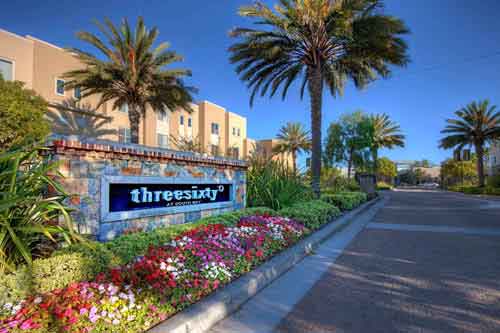
August 2019 was a somewhat unusual month for home sales in the Hollyglen and Del Aire neighborhoods of Hawthorne as none of the sales were in the gated community of 360. As prices in Three Sixty can be a bit higher they often drive overall median prices up. Overall there were 11 on market home sales with a median list price of $815,000 and a median sales price of $840,000 indicating strong demand and showing that we’re still in a sellers market. See the current homes for sale in Hollyglen and Del Aire.
| Type | Address | Price | Price per Ft | Bed/Bath | Sq Feet | Year | Sold Date | |
| SFR/D | 5003 W | 123rd ST | $650,000 | $650.65 | 3/0,1,0,0 | 999/A | 1944/ASR | 8/26/2019 |
| TWNHS/A | 5412 W | 149th PL #10 | $678,000 | $678.00 | 2/2,0,0,0 | 1000/A | 2007/ASR | 8/1/2019 |
| TWNHS/A | 5403 W | 149th PL #15 | $727,000 | $586.29 | 2/2,0,0,0 | 1240/A | 2007/ASR | 8/15/2019 |
| SFR/D | 5437 W | 120th ST | $787,535 | $762.38 | 3/1,0,0,0 | 1033/A | 1946/PUB | 8/2/2019 |
| SFR/D | 4941 W | 129TH ST | $799,000 | $422.30 | 4/2,0,0,0 | 1892/A | 1970 | 8/20/2019 |
| SFR/D | 5240 W | 123rd PL | $840,000 | $713.07 | 3/1,1,0,0 | 1178/A | 1950/ASR | 8/13/2019 |
| SFR/D | 5253 | Wiseburn ST | $852,000 | $760.71 | 3/1,1,0,0 | 1120/A | 1955/ASR | 8/21/2019 |
| SFR/D | 13236 | Delafield AVE | $879,000 | $782.03 | 3/2,0,0,0 | 1124/A | 1955/ASR | 8/12/2019 |
| SFR/D | 13718 | Grider AVE | $885,000 | $588.43 | 3/2,0,0,0 | 1504/A | 1954/PUB | 8/29/2019 |
| SFR/D | 13734 | Judah AVE | $990,000 | $692.31 | 4/2,0,1,0 | 1430/A | 1954/ASR | 8/1/2019 |
| SFR/D | 13211 | Clyde Park AVE | $1,180,000 | $684.06 | 4/2,0,1,0 | 1725/A | 1955/ASR | 8/21/2019 |