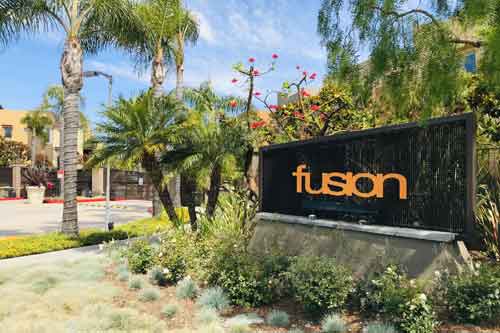
If you’re looking for something fairly close to the beach that’s newer and won’t break the bank, Fusion South Bay might be a good fit. This gated community is just east of Manhattan Beach and ideal for those that can’t afford the Beach Cities but want to be as close as possible.
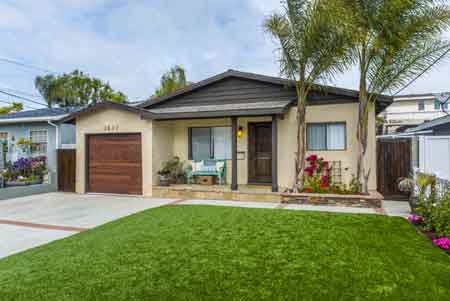
At the moment the only home for sale in Fusion is a 2 bedroom “B” floorplan at 5514 W 149th Pl #8 in Hollyglen Hawthorne CA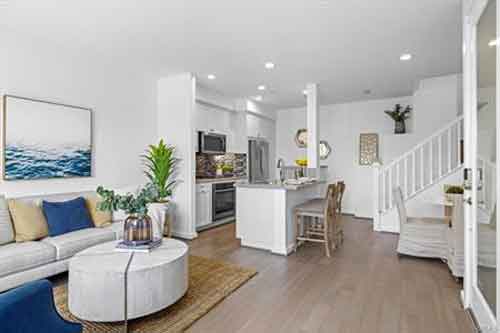 90250. The 2 level condo is well priced (compared with the recent sale of another B unit at $850,000) at $815,000. The B floorplan offers 2 bedrooms and 2 baths with a little over 1,000 sq feet. The B units sit above the similar A floorplans and one nice features is that both bedrooms are on the same level (unlike the A floorplan) and each has it’s own bathroom.
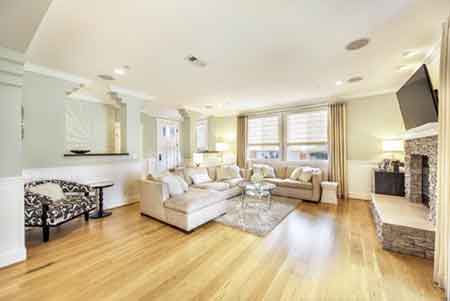
The condo is in nice condition with laminate flooring, upgraded kitchen and some very nice natural light.
As with all condos and townhomes in Fusion, the home has central A/C and is part of the award winning Wiseburn School District.
5514 W 149th Place #8 Facts and Features
- 2 bedrooms, each with private bath, on the upper level
- 2 1/2 baths
- Approx 1,067 square feet*(btv)
- Low HOA dues of $293
- Listed at $815,000
- Listied by Taya Dicarlo – Compass – 310-241-3038
Contact Fusion real estate specialist Keith Kyle with Vista Sotheby’s International to request for more information
*As with all of the layouts in Fusion the square footage differs between the tax records and the original buider plans.
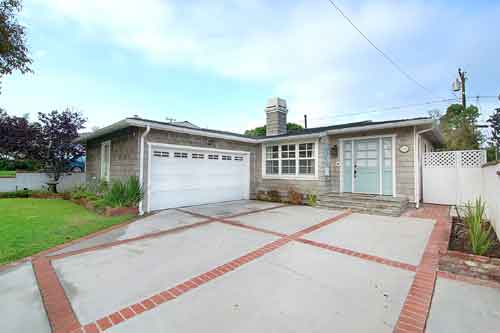
5514 W 149th Place Unit#8, Hawthorne, CA 90250 – Listed at $815,000
Any information relating to a property referenced on this web site comes from CRMLS. This web site may reference real estate listing(s) held by a brokerage firm other than the broker and/or agent who owns this website. The accuracy of all information is deemed reliable but not guaranteed and should be personally verified through personal inspection by and/or with the appropriate professionals.

 & Del Aire neighborhoods of Hawthorne last month.