
Hollyglen Home Sales in May of 2019
May 2019 was a very solid month for home sales in Hollyglen and Del Aire. There were 15 home sales during the month with the lowest price sale being at $620,000 for a smaller 868 sq foot single family home and the highest price of the month was $1,360,000 for a 4 bedroom single family home style Terrace home in 360 South Bay. Of the 15 sales 2 were in Fusion South Bay and 5 were located in the gated community of Three Sixty.
See the current homes for sale in Hollyglen here. Want an even easier way to keep current with the market? Tell us just a bit about your dream home and we’ll customize a home search just for you and send you FREE email alerts when a new listing hits the market.
May 2019 Home Sales
| Type | Address | Close Price / List Price | $ Per Foot | Bed/Bath | Sq Feet | Year Built | COE Date | |
| TWNHS/A | 5403 W | 149th PL #4 | $799,000 | $583.21 | 2/1,1,1,0 | 1370/A | 2007/ASR | 5/1/2019 |
| SFR/D | 5565 | Palm DR | $1,135,000 / $1,129,000 | $601.48 | 3/2,0,1,0 | 1887/T | 2014/ASR | 5/3/2019 |
| SFR/D | 4867 W | 134th ST | $685,000 / $725,000 | $708.38 | 3/1,0,0,0 | 967/A | 1923/APP | 5/10/2019 |
| TWNHS/A | 5412 W | 149th PL #4 | $807,000 / $810,000 | $589.05 | 2/1,1,1,0 | 1370/A | 2007/ASR | 5/14/2019 |
| SFR/D | 5430 W | 120th ST | $700,000 / $679,000 | $697.91 | 2/1,0,0,0 | 1003/A | 1949/ASR | 5/15/2019 |
| SFR/D | 5037 W | 138th ST | $620,000 / $645,000 | $714.29 | 2/1,0,0,0 | 868/A | 1950/ASR | 5/16/2019 |
| TWNHS/D | 5523 | Palm DR | $1,225,000 / $1,249,000 | $560.13 | 4/2,0,1,0 | 2187/A | 2014/PUB | 5/16/2019 |
| SFR/D | 5540 | Palm DR | $1,360,000 / $1,325,000 | $561.29 | 4/2,0,1,0 | 2423/P | 2014/PUB | 5/17/2019 |
| SFR/D | 5240 | Pacific Terrace | $1,340,000 / $1,349,000 | $553.03 | 4/3,0,0,0 | 2423/A | 2014/ASR | 5/21/2019 |
| SFR/D | 5351 W | 123RD PL | $840,000 / $780,000 | $776.34 | 3/1,1,0,0 | 1082/SEE | 1950 | 5/22/2019 |
| CONDO/A | 5450 | Strand #402 | $865,000 / $849,000 | $572.47 | 2/2,0,0,0 | 1511/B | 2013/ASR | 5/22/2019 |
| SFR/D | 5005 W | 120th ST | $877,000 / $949,900 | $324.81 | 4/3,0,1,0 | 2700/S | 2018/SLR | 5/22/2019 |
| SFR/D | 5519 W | 123rd PL | $910,000 / $939,000 | $803.89 | 3/2,0,0,0 | 1132/A | 1950/ASR | 5/24/2019 |
| SFR/D | 5120 W | 131st ST | $818,000 / $839,900 | $520.03 | 4/2,0,0,0 | 1573/S | 1947/ASR | 5/31/2019 |
| SFR/D | 5307 W | 139th ST | $959,000 | $721.05 | 3/2,0,0,0 | 1330/A | 1955/ASR | 5/31/2019 |
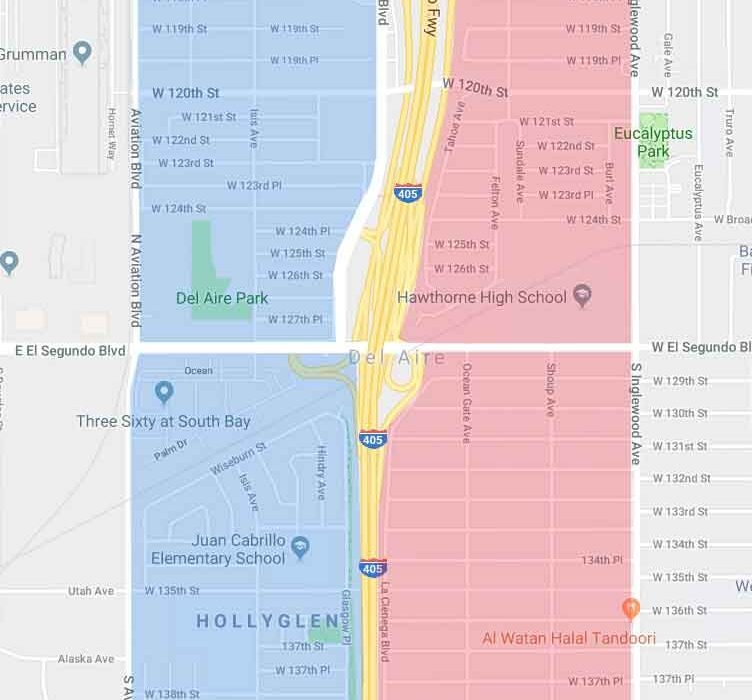
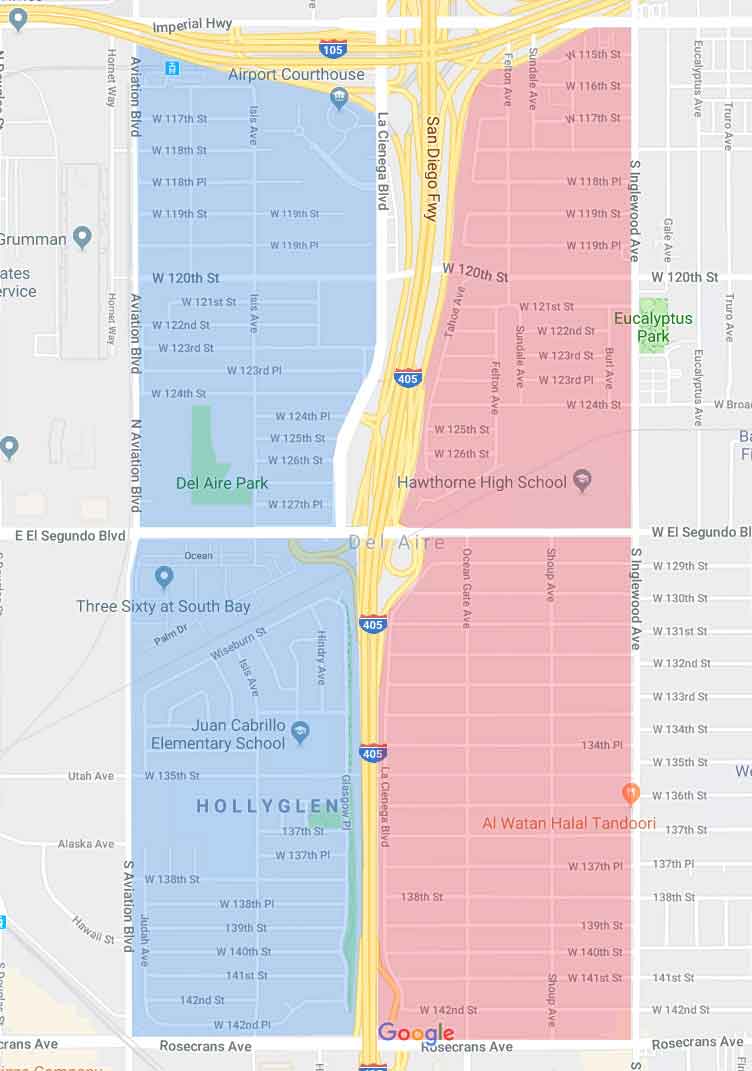 location.” From a real estate market perspective, the Hollyglen/Del Aire area basically consists of two distinct areas….the strip of homes west of the 405 Freeway and the homes East of the 405. Values have always been higher on the west for a number of reasons. All of the homes west of the freeway attend the Wiseburn School District while only about half of the homes east of the 405 do (rest are part of Centinela Valley district). There is less commercial around the neighrhoods on the west.
 the full list of the 159 homes that sold in 2018 in Hollygle and Del Aire. The average list price for the year was a pretty impressive $821,000 with an even more impressive average sales prices of $837,000 meaning on average homes sold well higher than list price. That’s especially impressive given that many sellers listed their homes for record numbers.
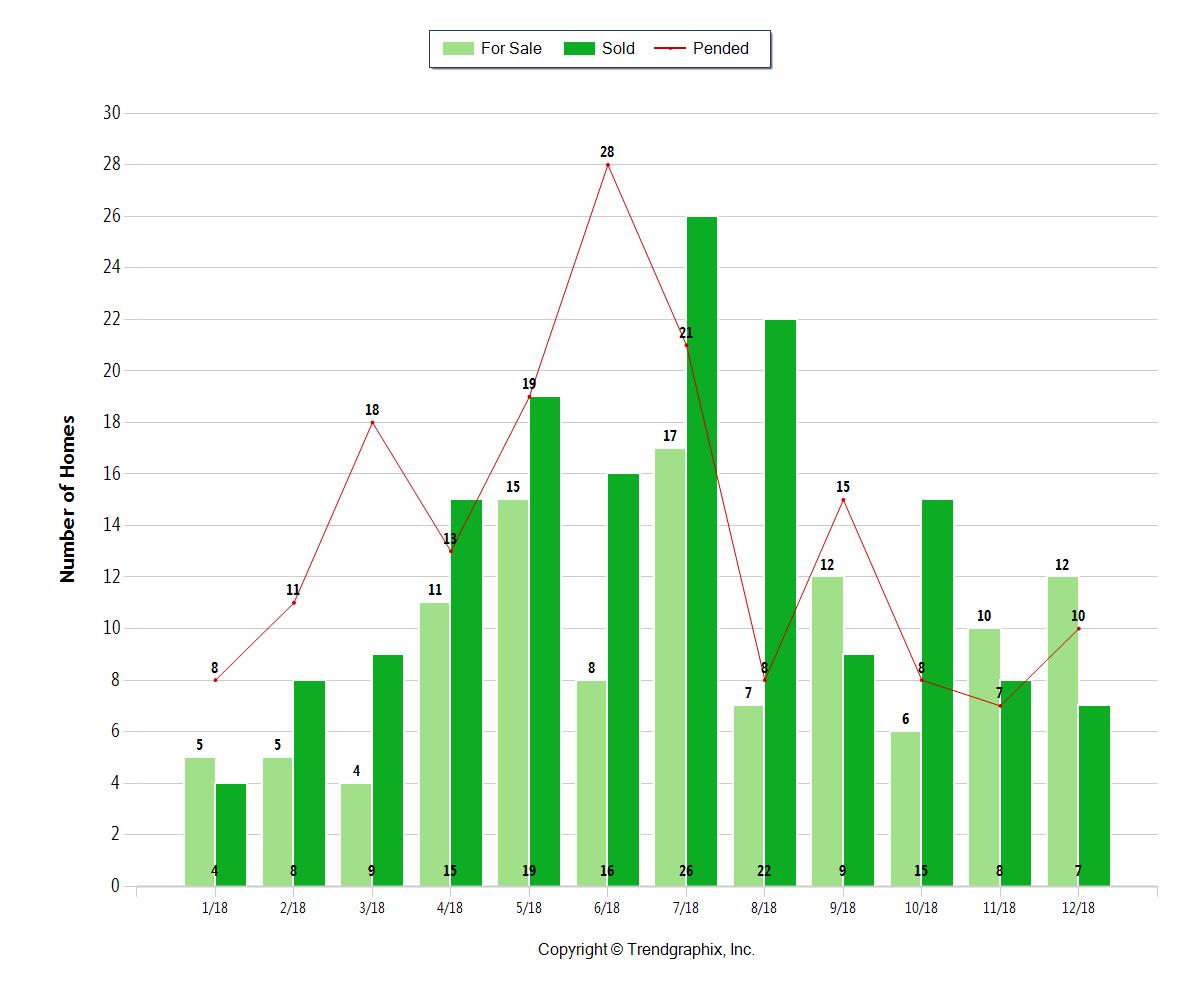
 small coastal area outside of Los Angeles is technically part of Hawthorne. Hawthorne recorded a very high 45 homes sales with a median price of $592,000 while the Hollyglen/Del Aire area saw 14 home sales with a median price of $805,000. Of the 14 sales 2 were