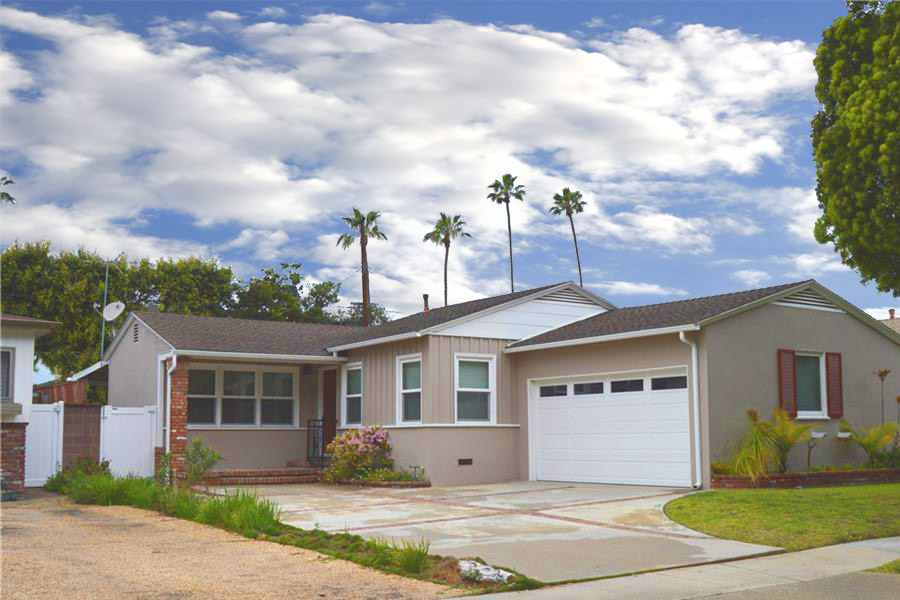
February 2020 Real Estate Recap – Hollyglen Home Sales and Home Prices
February was a very slow month for closed home sales in Hollyglen and Del Aire  with only 7 homes sold during the month. That’s the fewest home sales in a month over the past 18 months other than December 2018 and 2019 (which is typically very slow) Prices were solid as they’ve been over the past 18 months with the median list prices of $849,000 and a median sales price of $832,000. Average price per foot for sold homes in Manhattan Beach was $608. Median days on market was only 8 which is absolutely amazingand another indication of a strong sellers market. Three of the home sales were in Three Sixty South Bay with no sales (or listings) in Fusion South Bay. See the Hollyglen and Del Aire real estate stats for the past 15 months below.
View the current homes for sale in Hollyglen and Del Aire CA
February 2020 Home Sales and Prices in Hollyglen and Del Aire.
| MLS # | Type | Address | Price | $ Per Foot | Bed/Bath | Sq Feet | Year | Sale Date | |
| 20543976 | SFR | 5257 W | 123RD PL | $1,305,000 | $572.87 | 4/3,0,0,0 | 2278/ | 2009 | 2/24/2020 |
| SB19284705 | CONDO/A | 12917 | Central AV | $860,000 | $589.04 | 2/2,0,0,0 | 1460/A | 2011/ASR | 2/14/2020 |
| SB20009230 | SFR/D | 5034 W | 125th ST | $850,000 | $607.14 | 3/2,0,0,0 | 1400/S | 1944/PUB | 2/18/2020 |
| OC19284490 | TWNHS/A | 12824 | City DR # | $832,000 | $569.86 | 2/3,0,0,0 | 1460/A | 2013/BLD | 2/4/2020 |
| SR19260173 | SFR/D | 4922 W | 137th ST | $828,000 | $621.62 | 3/2,0,0,0 | 1332/A | 1951/ASR | 2/4/2020 |
| SB19280826 | TWNHS/A | 5555 | Ocean # | $827,000 | $626.52 | 2/2,0,1,0 | 1320/A | 2010/ASR | 2/14/2020 |
| SB20040689 | SFR/D | 5015 W | 131st ST | $560,000 | $673.08 | 2/1,0,0,0 | 832/A | 1947/ASR | 2/25/2020 |
